find-pitch.pyfind-pitch.py
#?##################################################################################################
#?#
#?# Musica - A Music Theory Package for Python
#?# Copyright (C) 2017 Fabrice Salvaire
#?#
#?# This program is free software: you can redistribute it and/or modify
#?# it under the terms of the GNU General Public License as published by
#?# the Free Software Foundation, either version 3 of the License, or
#?# (at your option) any later version.
#?#
#?# This program is distributed in the hope that it will be useful,
#?# but WITHOUT ANY WARRANTY; without even the implied warranty of
#?# MERCHANTABILITY or FITNESS FOR A PARTICULAR PURPOSE. See the
#?# GNU General Public License for more details.
#?#
#?# You should have received a copy of the GNU General Public License
#?# along with this program. If not, see <http://www.gnu.org/licenses/>.
#?#
#?##################################################################################################
#!# ======================================
#!# Find the Pitch of a Vibrating String
#!# ======================================
#!# This example shows how to find the pitch of a guitare string using a spectral analysis.
####################################################################################################
import os
import numpy as np
import matplotlib.pyplot as plt
from Musica.Audio.AudioFormat import AudioFormat
####################################################################################################
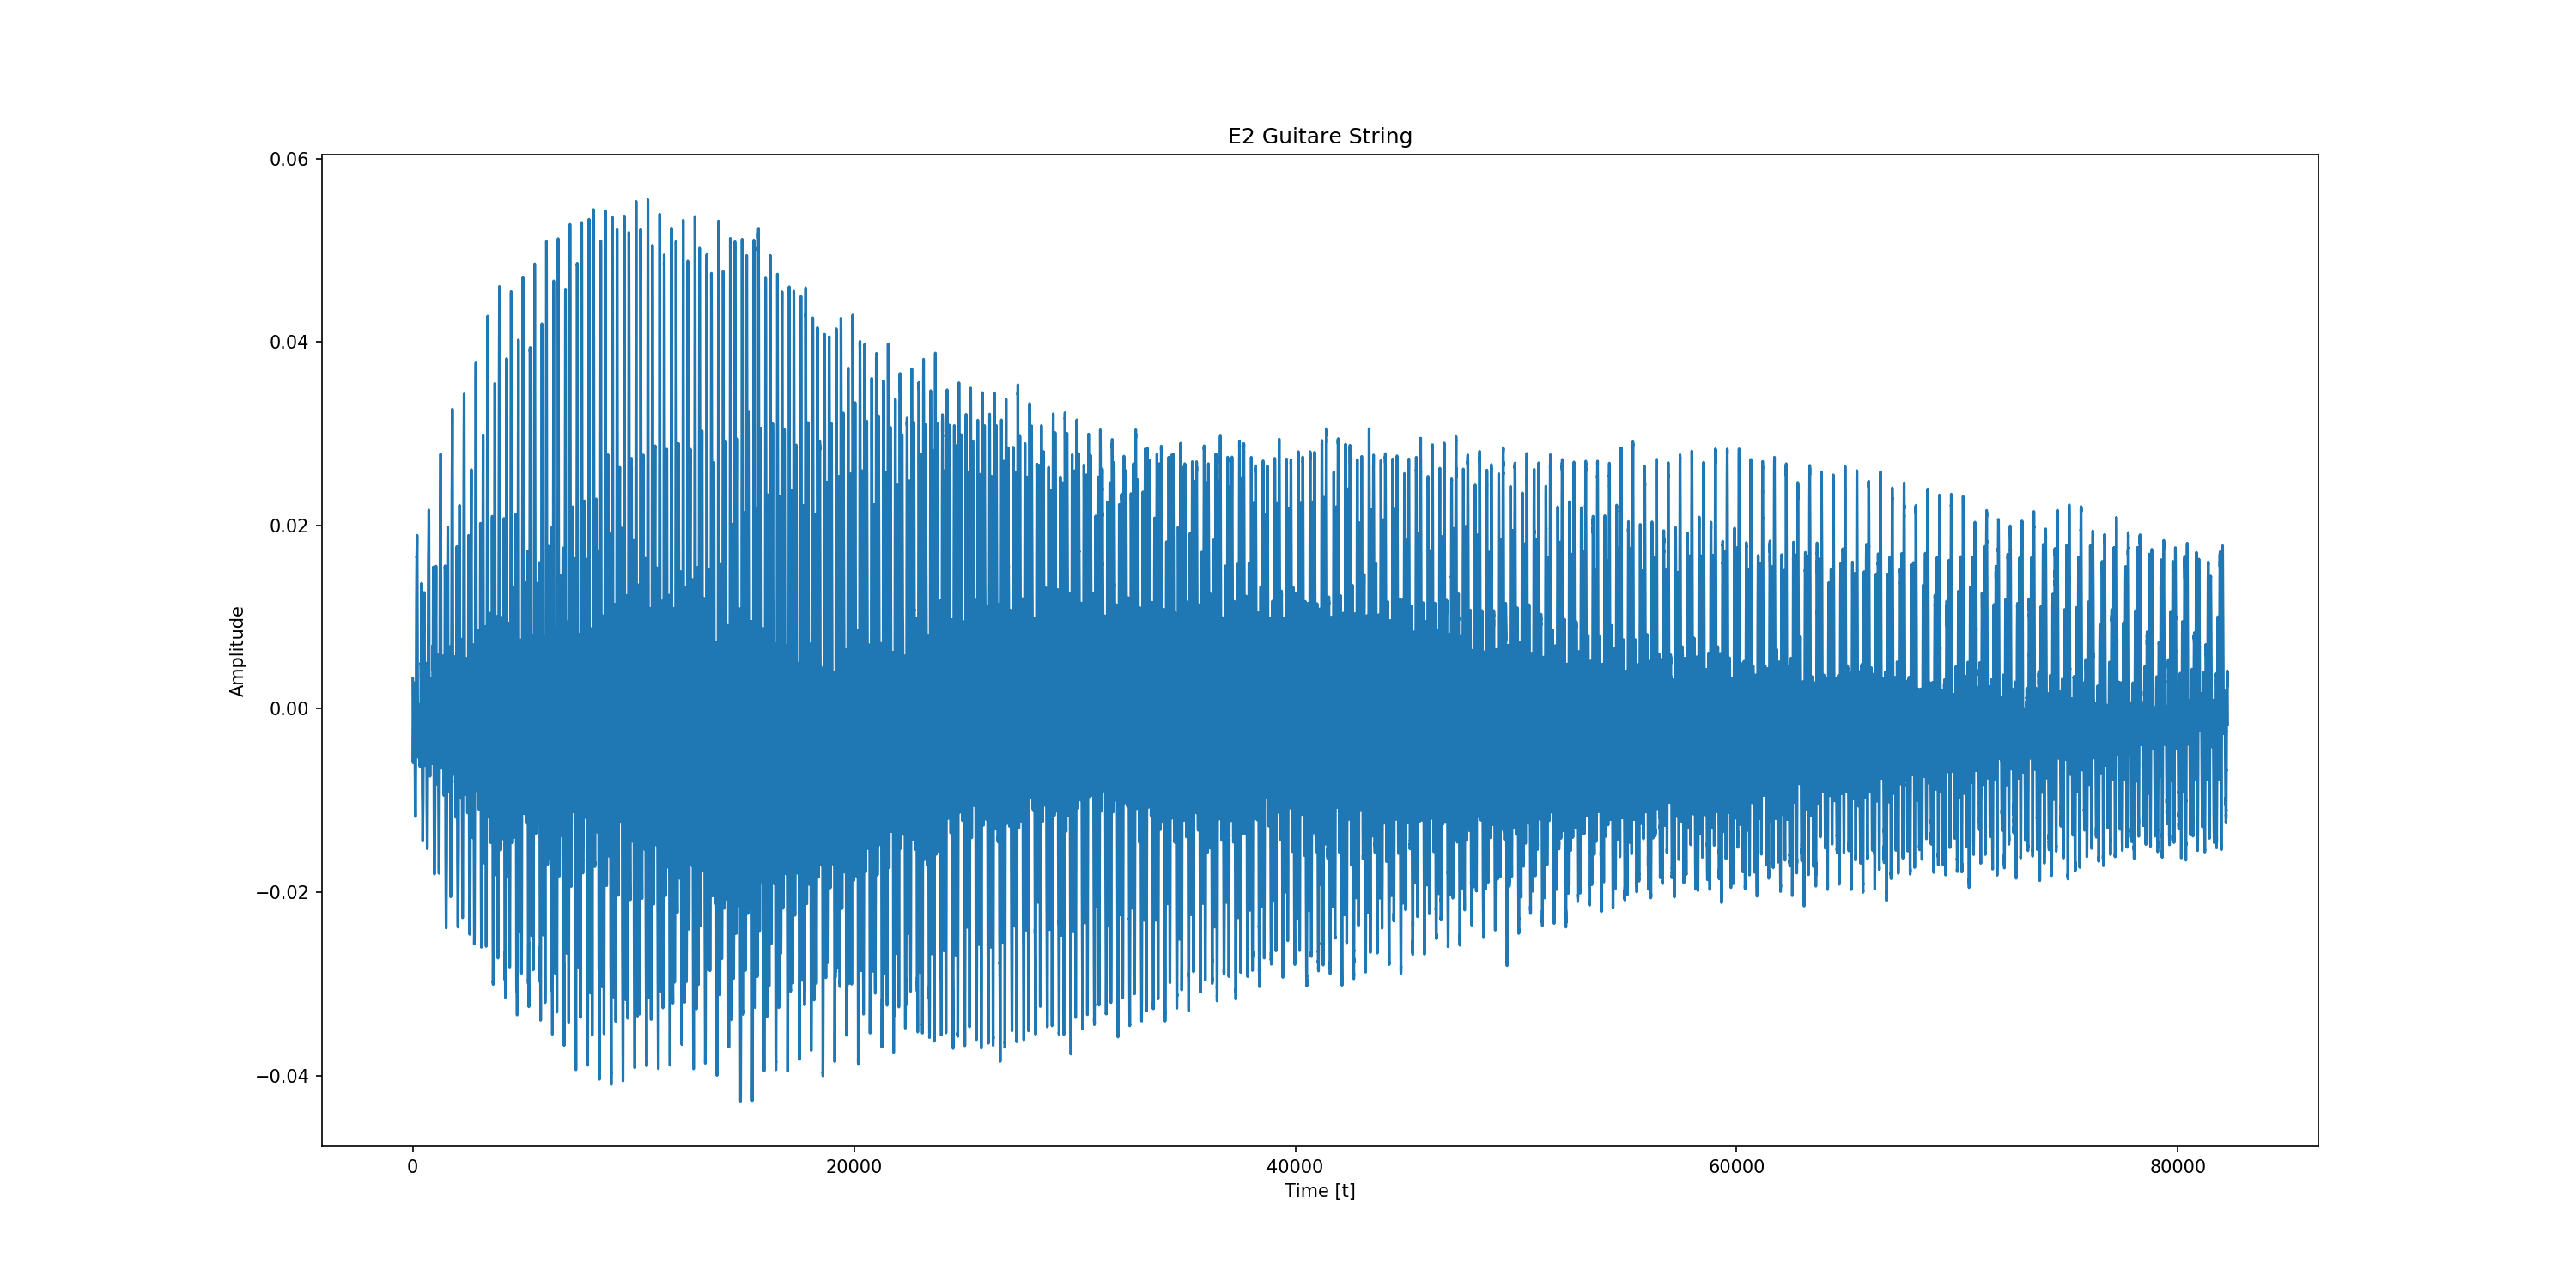
#!# We load a wav file containing a recording of a E2 guitar string.
wav_path = os.path.join(os.path.dirname(__file__), '..', '..',
'data', 'string-waves', 'clean', 'E2.1.wav')
audio = AudioFormat.open(wav_path)
figure1 = plt.figure(1, (20, 10))
axe = plt.subplot(111)
data = audio.channel(0, as_float=True)
axe.plot(data)
axe.set_title('E2 Guitare String')
axe.set_xlabel('Time [t]')
axe.set_ylabel('Amplitude')
#fig# save_figure(figure1, 'data.png')
spectrum = audio.spectrum(0, number_of_samples=2**16)
figure2 = plt.figure(1, (20, 10))
axe = plt.subplot(111)
axe.grid()
#? axe.plot(spectrum.values)
# axe.semilogx(spectrum.frequencies, spectrum.magnitude)
axe.semilogx(spectrum.frequencies, spectrum.decibel_power)
#? axe.semilogx(spectrum.frequencies, spectrum.h_dome(20), 'o-')
axe.set_title('Spectrum')
axe.set_xlabel('Frequencies [Hz]')
axe.set_ylabel('Power [db]')
#fig# save_figure(figure2, 'spectrum.png')
figure3 = plt.figure(1, (20, 10))
axe = plt.subplot(111)
frequencies, hfs = spectrum.hfs(5)
axe.semilogx(frequencies, hfs, 'o-')
axe.grid()
axe.set_title('Harmonic Product Spectrum')
axe.set_xlabel('Frequencies [Hz]')
axe.set_ylabel('Amplitude')
#fig# save_figure(figure3, 'hfs.png')
i_max = np.argmax(hfs)
string_frequency = frequencies[i_max]
frequency_error = spectrum.frequency_resolution
# print('Frequency: {:.1f} +- {:.1f} Hz'.format(string_frequency, frequency_error))
#!# String frequency = @<@string_frequency:.1f@>@ +- @<@frequency_error:.1f@>@ Hz
plt.tight_layout()
plt.show()
8.2.1. Find the Pitch of a Vibrating String
This example shows how to find the pitch of a guitare string using a spectral analysis.
import os

import numpy as np
import matplotlib.pyplot as plt

from Musica.Audio.AudioFormat import AudioFormat
We load a wav file containing a recording of a E2 guitar string.
wav_path = os.path.join(os.path.dirname(__file__), '..', '..',
                        'data', 'string-waves', 'clean', 'E2.1.wav')
audio = AudioFormat.open(wav_path)

figure1 = plt.figure(1, (20, 10))
axe = plt.subplot(111)
data = audio.channel(0, as_float=True)
axe.plot(data)
axe.set_title('E2 Guitare String')
axe.set_xlabel('Time [t]')
axe.set_ylabel('Amplitude')
spectrum = audio.spectrum(0, number_of_samples=2**16)

figure2 = plt.figure(1, (20, 10))
axe = plt.subplot(111)
axe.grid()
#? axe.plot(spectrum.values)
# axe.semilogx(spectrum.frequencies, spectrum.magnitude)
axe.semilogx(spectrum.frequencies, spectrum.decibel_power)
#? axe.semilogx(spectrum.frequencies, spectrum.h_dome(20), 'o-')
axe.set_title('Spectrum')
axe.set_xlabel('Frequencies [Hz]')
axe.set_ylabel('Power [db]')
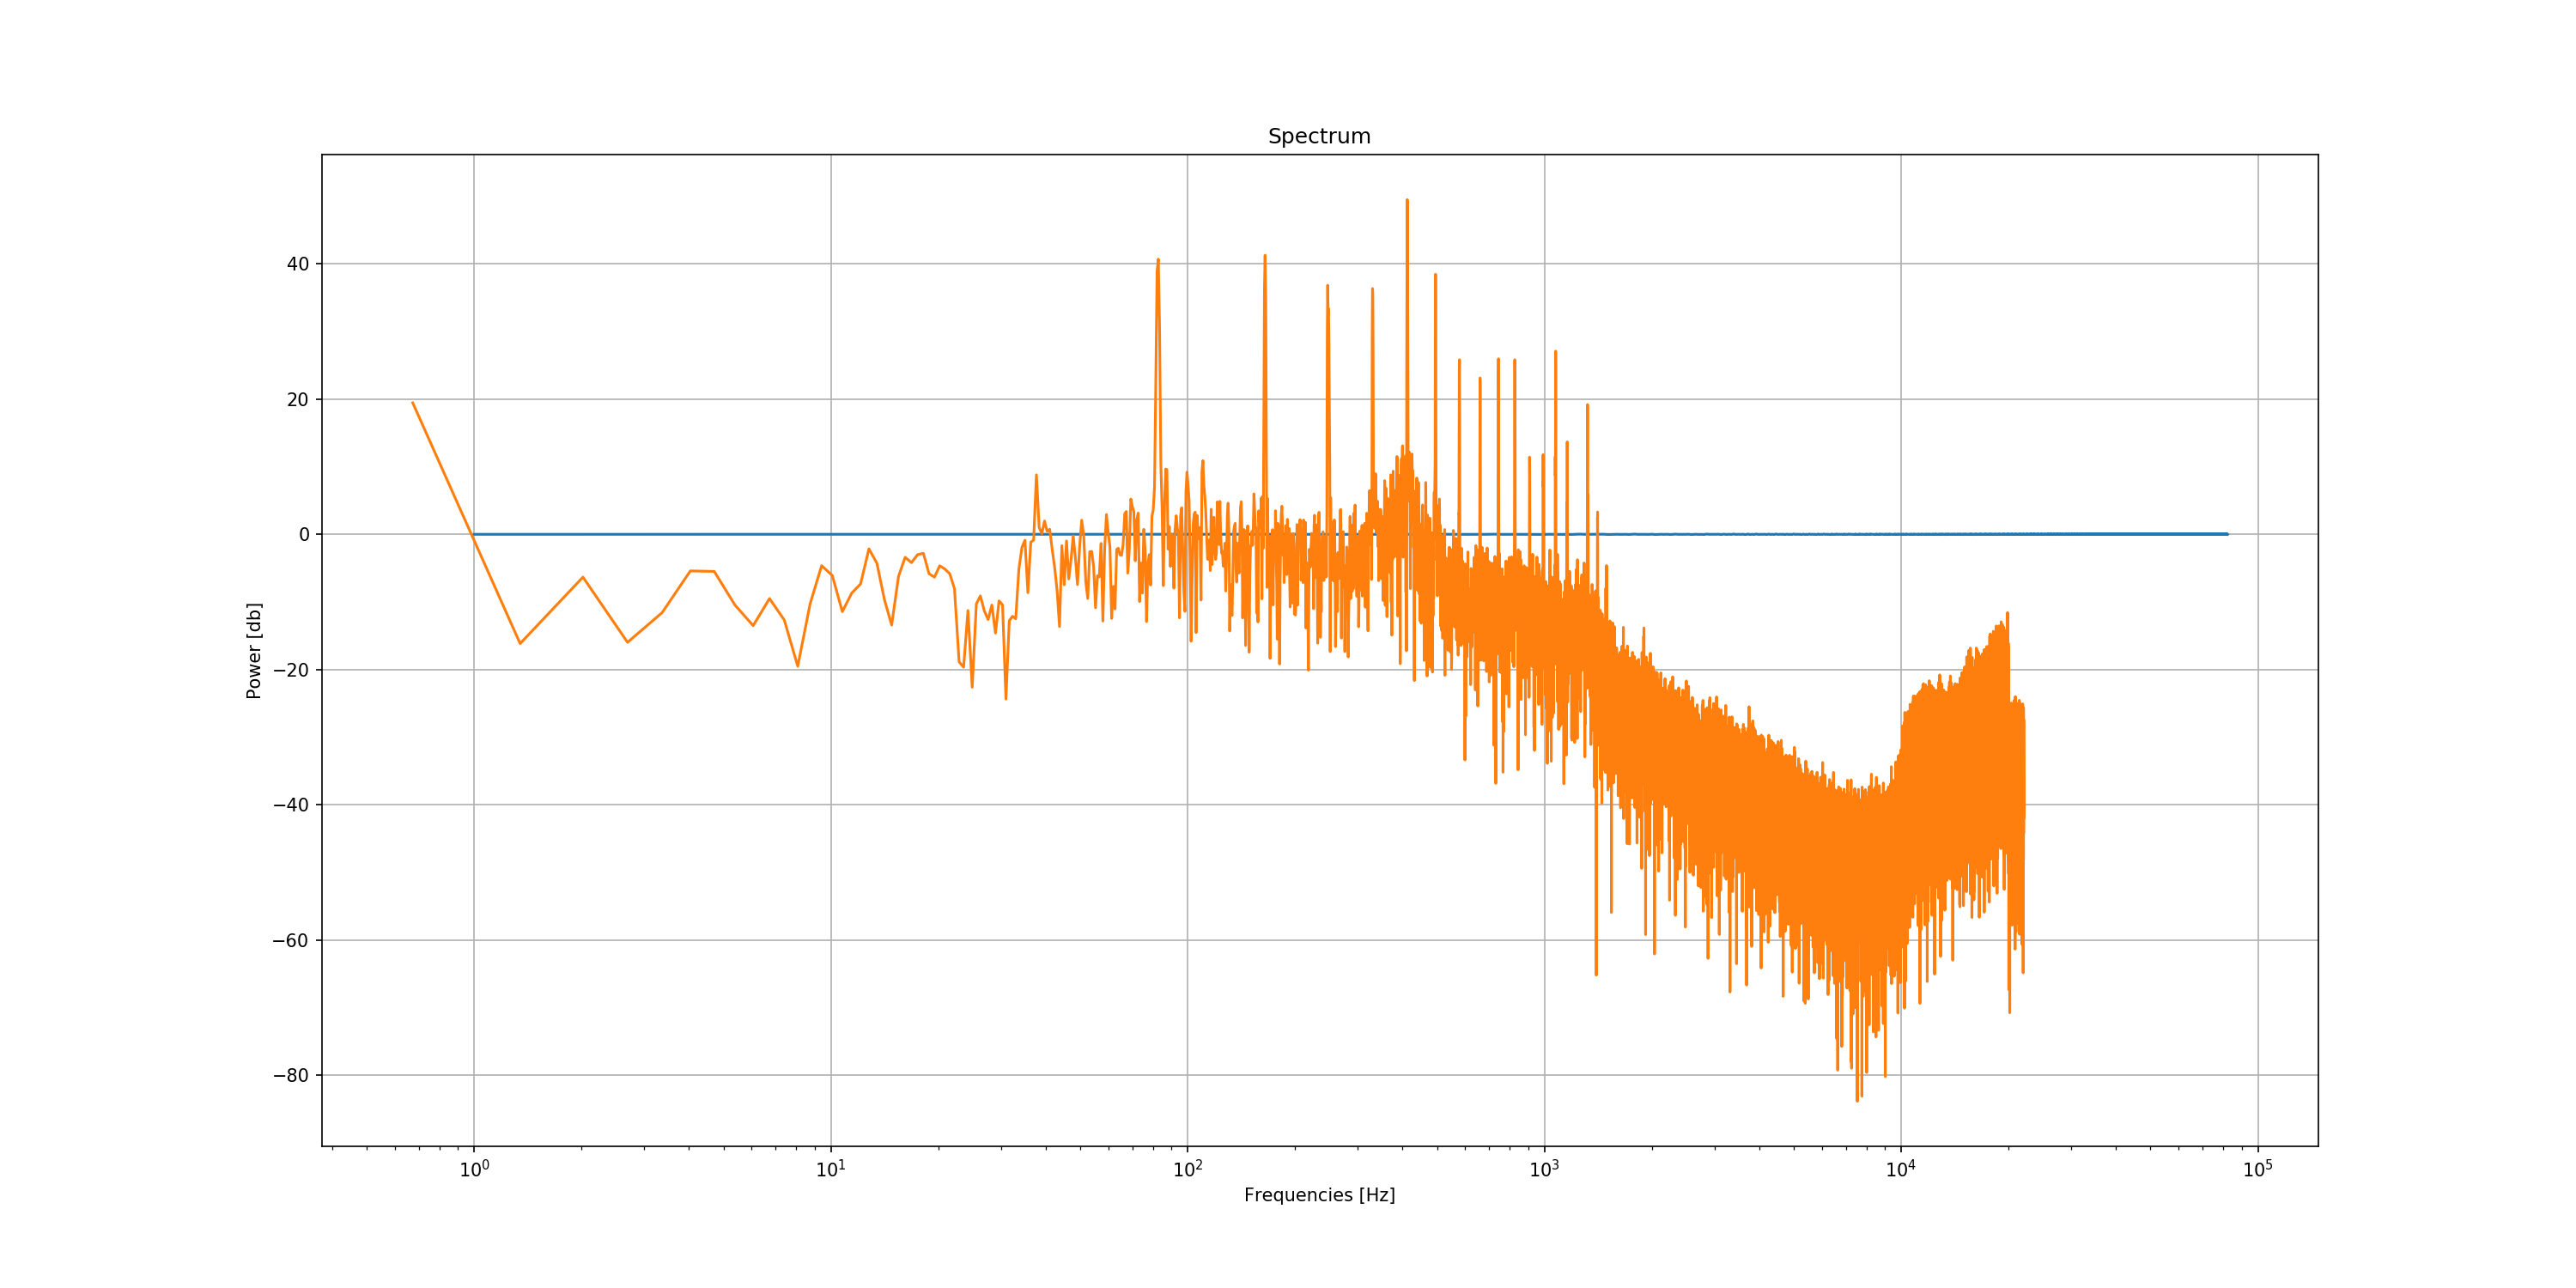
figure3 = plt.figure(1, (20, 10))
axe = plt.subplot(111)
frequencies, hfs = spectrum.hfs(5)
axe.semilogx(frequencies, hfs, 'o-')
axe.grid()
axe.set_title('Harmonic Product Spectrum')
axe.set_xlabel('Frequencies [Hz]')
axe.set_ylabel('Amplitude')
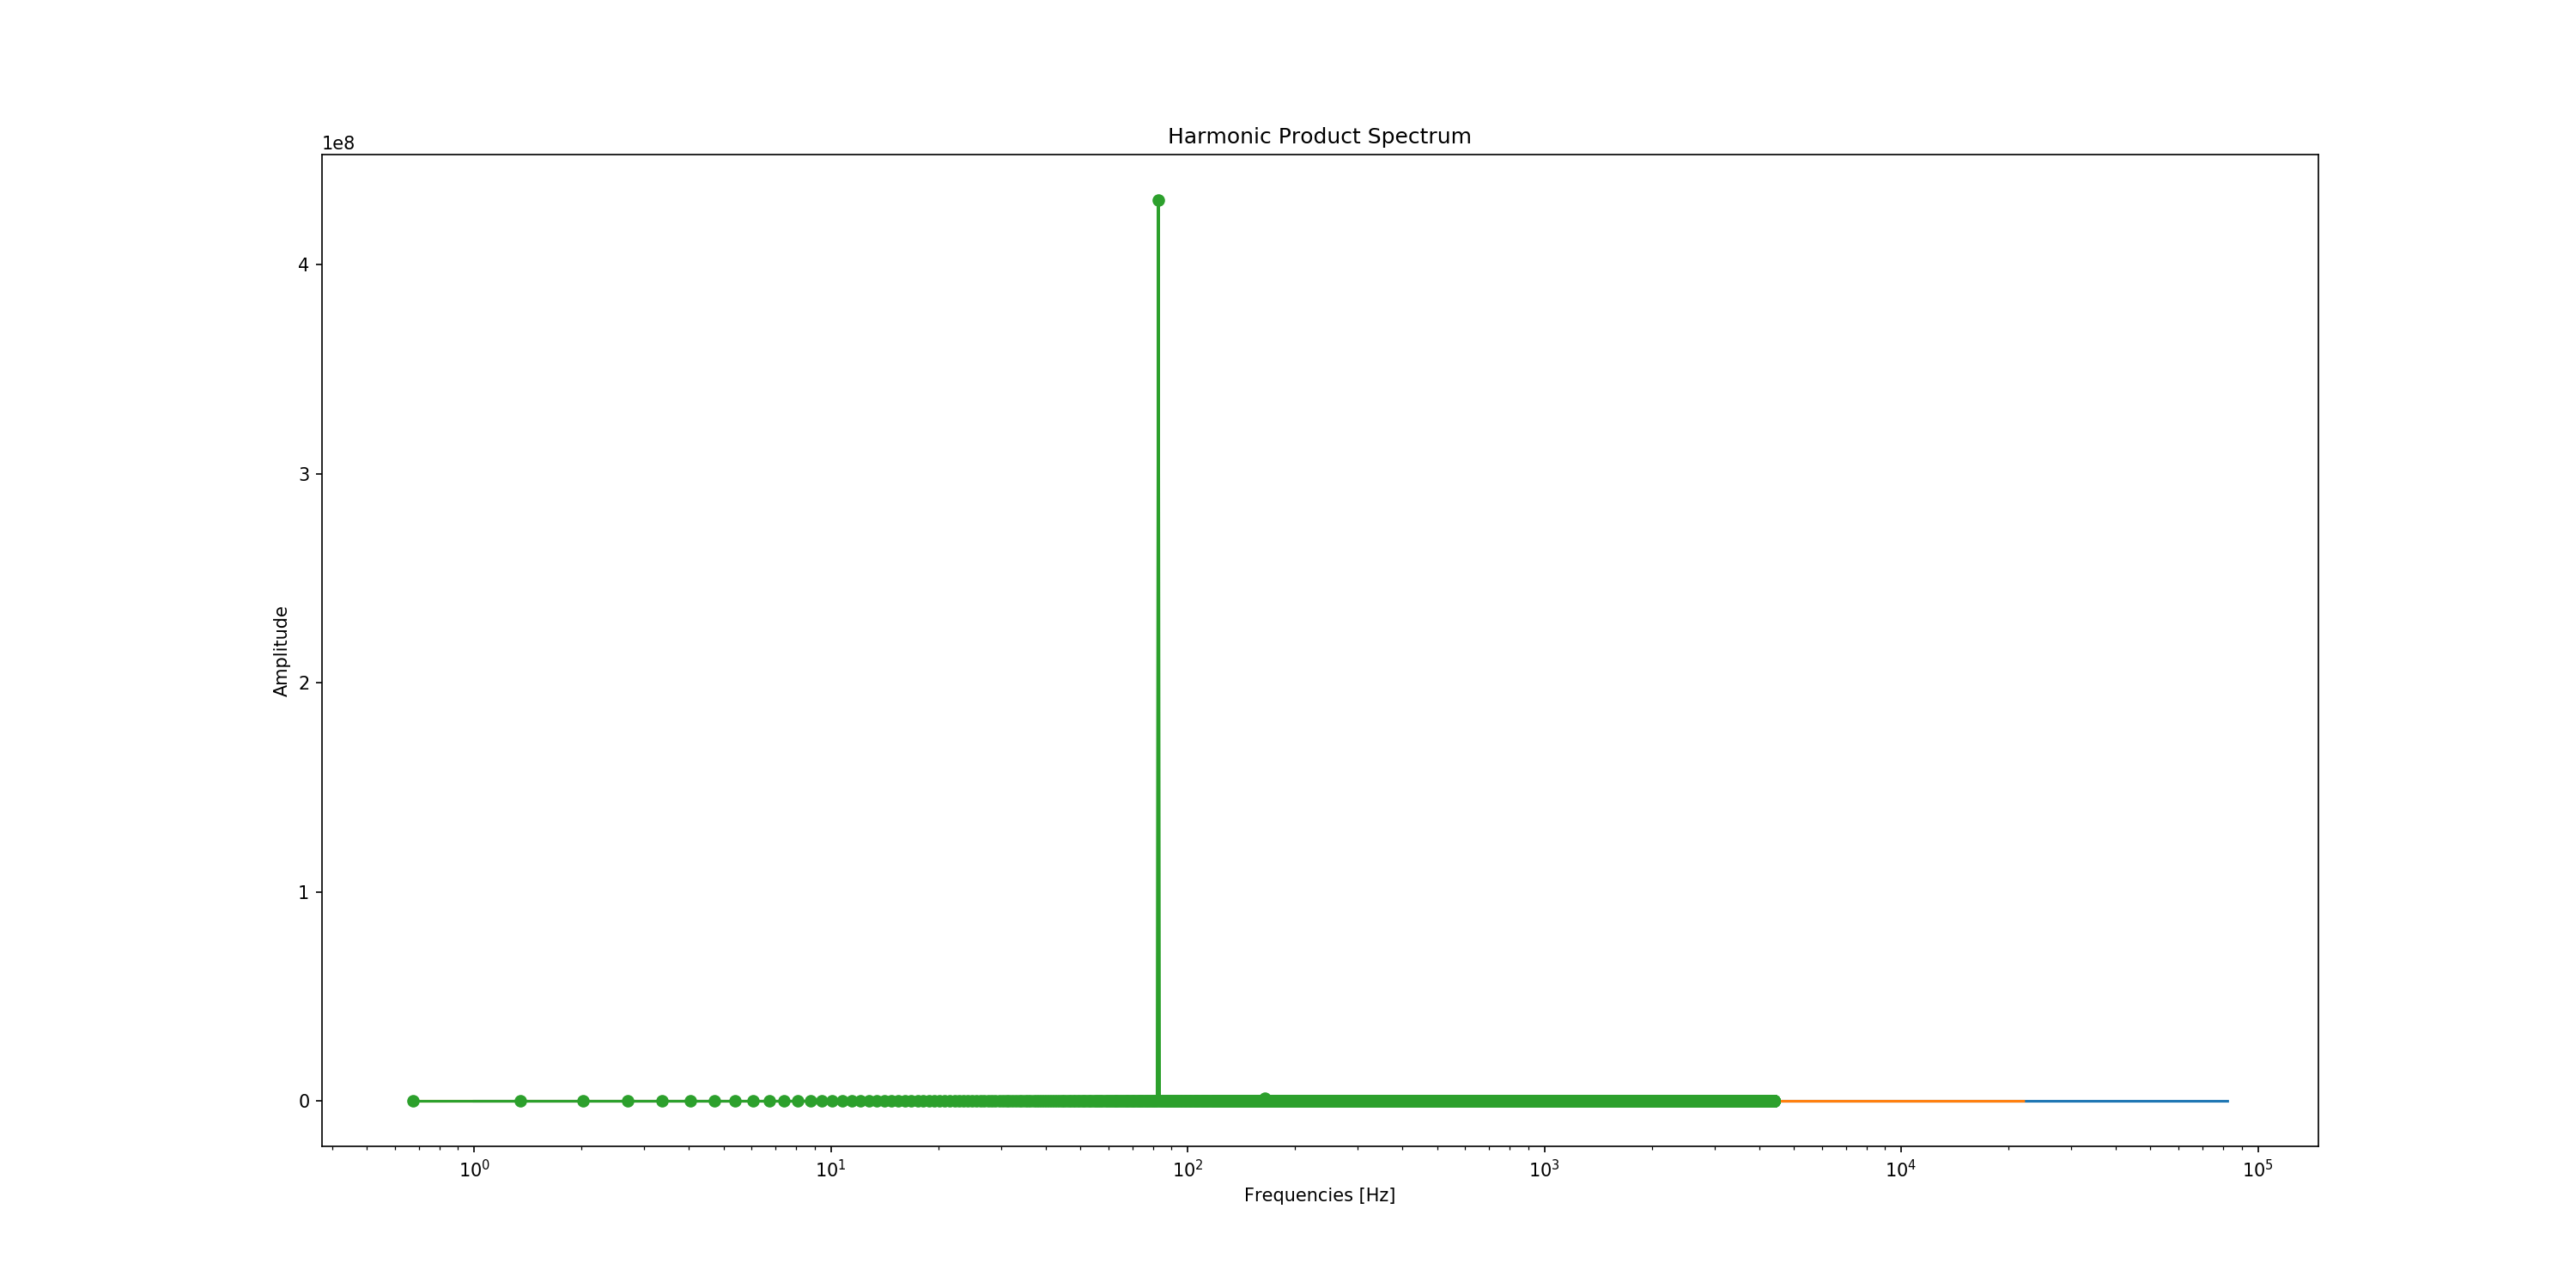
i_max = np.argmax(hfs)
string_frequency = frequencies[i_max]
frequency_error = spectrum.frequency_resolution
# print('Frequency: {:.1f} +- {:.1f} Hz'.format(string_frequency, frequency_error))
String frequency = 82.8 +- 0.7 Hz
plt.tight_layout()
plt.show()