beat.pybeat.py
#?##################################################################################################
#?#
#?# Musica - A Music Theory Package for Python
#?# Copyright (C) 2017 Fabrice Salvaire
#?#
#?# This program is free software: you can redistribute it and/or modify
#?# it under the terms of the GNU General Public License as published by
#?# the Free Software Foundation, either version 3 of the License, or
#?# (at your option) any later version.
#?#
#?# This program is distributed in the hope that it will be useful,
#?# but WITHOUT ANY WARRANTY; without even the implied warranty of
#?# MERCHANTABILITY or FITNESS FOR A PARTICULAR PURPOSE.  See the
#?# GNU General Public License for more details.
#?#
#?# You should have received a copy of the GNU General Public License
#?# along with this program.  If not, see <http://www.gnu.org/licenses/>.
#?#
#?##################################################################################################

#!# ===============
#!#  Acoustic Beat
#!# ===============

#?# This section illustrates beat.

#!# In acoustics, a beat is an interference pattern between two sounds of slightly different
#!# frequencies, perceived as a periodic variation in volume whose rate is the difference of the two
#!# frequencies.
#!#
#!# Theory
#!# ------
#!#
#!# The sum of two sinusoidal signals is:
#!#
#!# .. math::
#!#
#!#     \cos(2\pi f_1 t) + \cos(2\pi f_2 t) = 2 \cos\left(2\pi \frac{f_1 + f_2}{2} t\right) \cos\left(2\pi \frac{f_1 - f_2}{2} t\right)
#!#
#!# If the frequencies are close enough, we can rewrite this expression using :math:`f2 = f1 + f_\delta`
#!#
#!# .. math::
#!#
#!#     \cos(2\pi f_1 t) + \cos(2\pi f_2 t) = 2 \cos\left(2\pi \frac{2 f_1 + f_\delta}{2} t\right) \cos\left(2\pi \frac{f_\delta}{2} t\right)
#!#
#!# where :math:`f_\text{beat} = f2 - f1 = f_\delta`
#!#
#!# Simulation
#!# ----------

####################################################################################################

import numpy as np
import matplotlib.pyplot as plt
from matplotlib.ticker import MultipleLocator

from Musica.Math.MusicTheory import *

####################################################################################################

delta_frequency = Frequency(5)
frequency1 = Frequency(100)
frequency2 = Frequency(float(frequency1) + float(delta_frequency))
beat_frequency = Frequency(float(delta_frequency) / 2)

t = np.arange(0, beat_frequency.period, frequency1.period / 100)

y1 = np.cos(t * frequency1.pulsation)
y2 = np.cos(t * frequency2.pulsation)
yb = 2 * np.cos(t * beat_frequency.pulsation)

figure = plt.figure(1, (20, 10))

axe = plt.subplot(111)
axe.set_title('Beat')
axe.set_xlabel('Time')
axe.set_ylabel('Amplitude')
axe.grid()
axe.plot(t, y1)
axe.plot(t, y2)
axe.plot(t, y1 + y2)
axe.plot(t, yb)

plt.show()

#fig# save_figure(figure, 'beat.png')
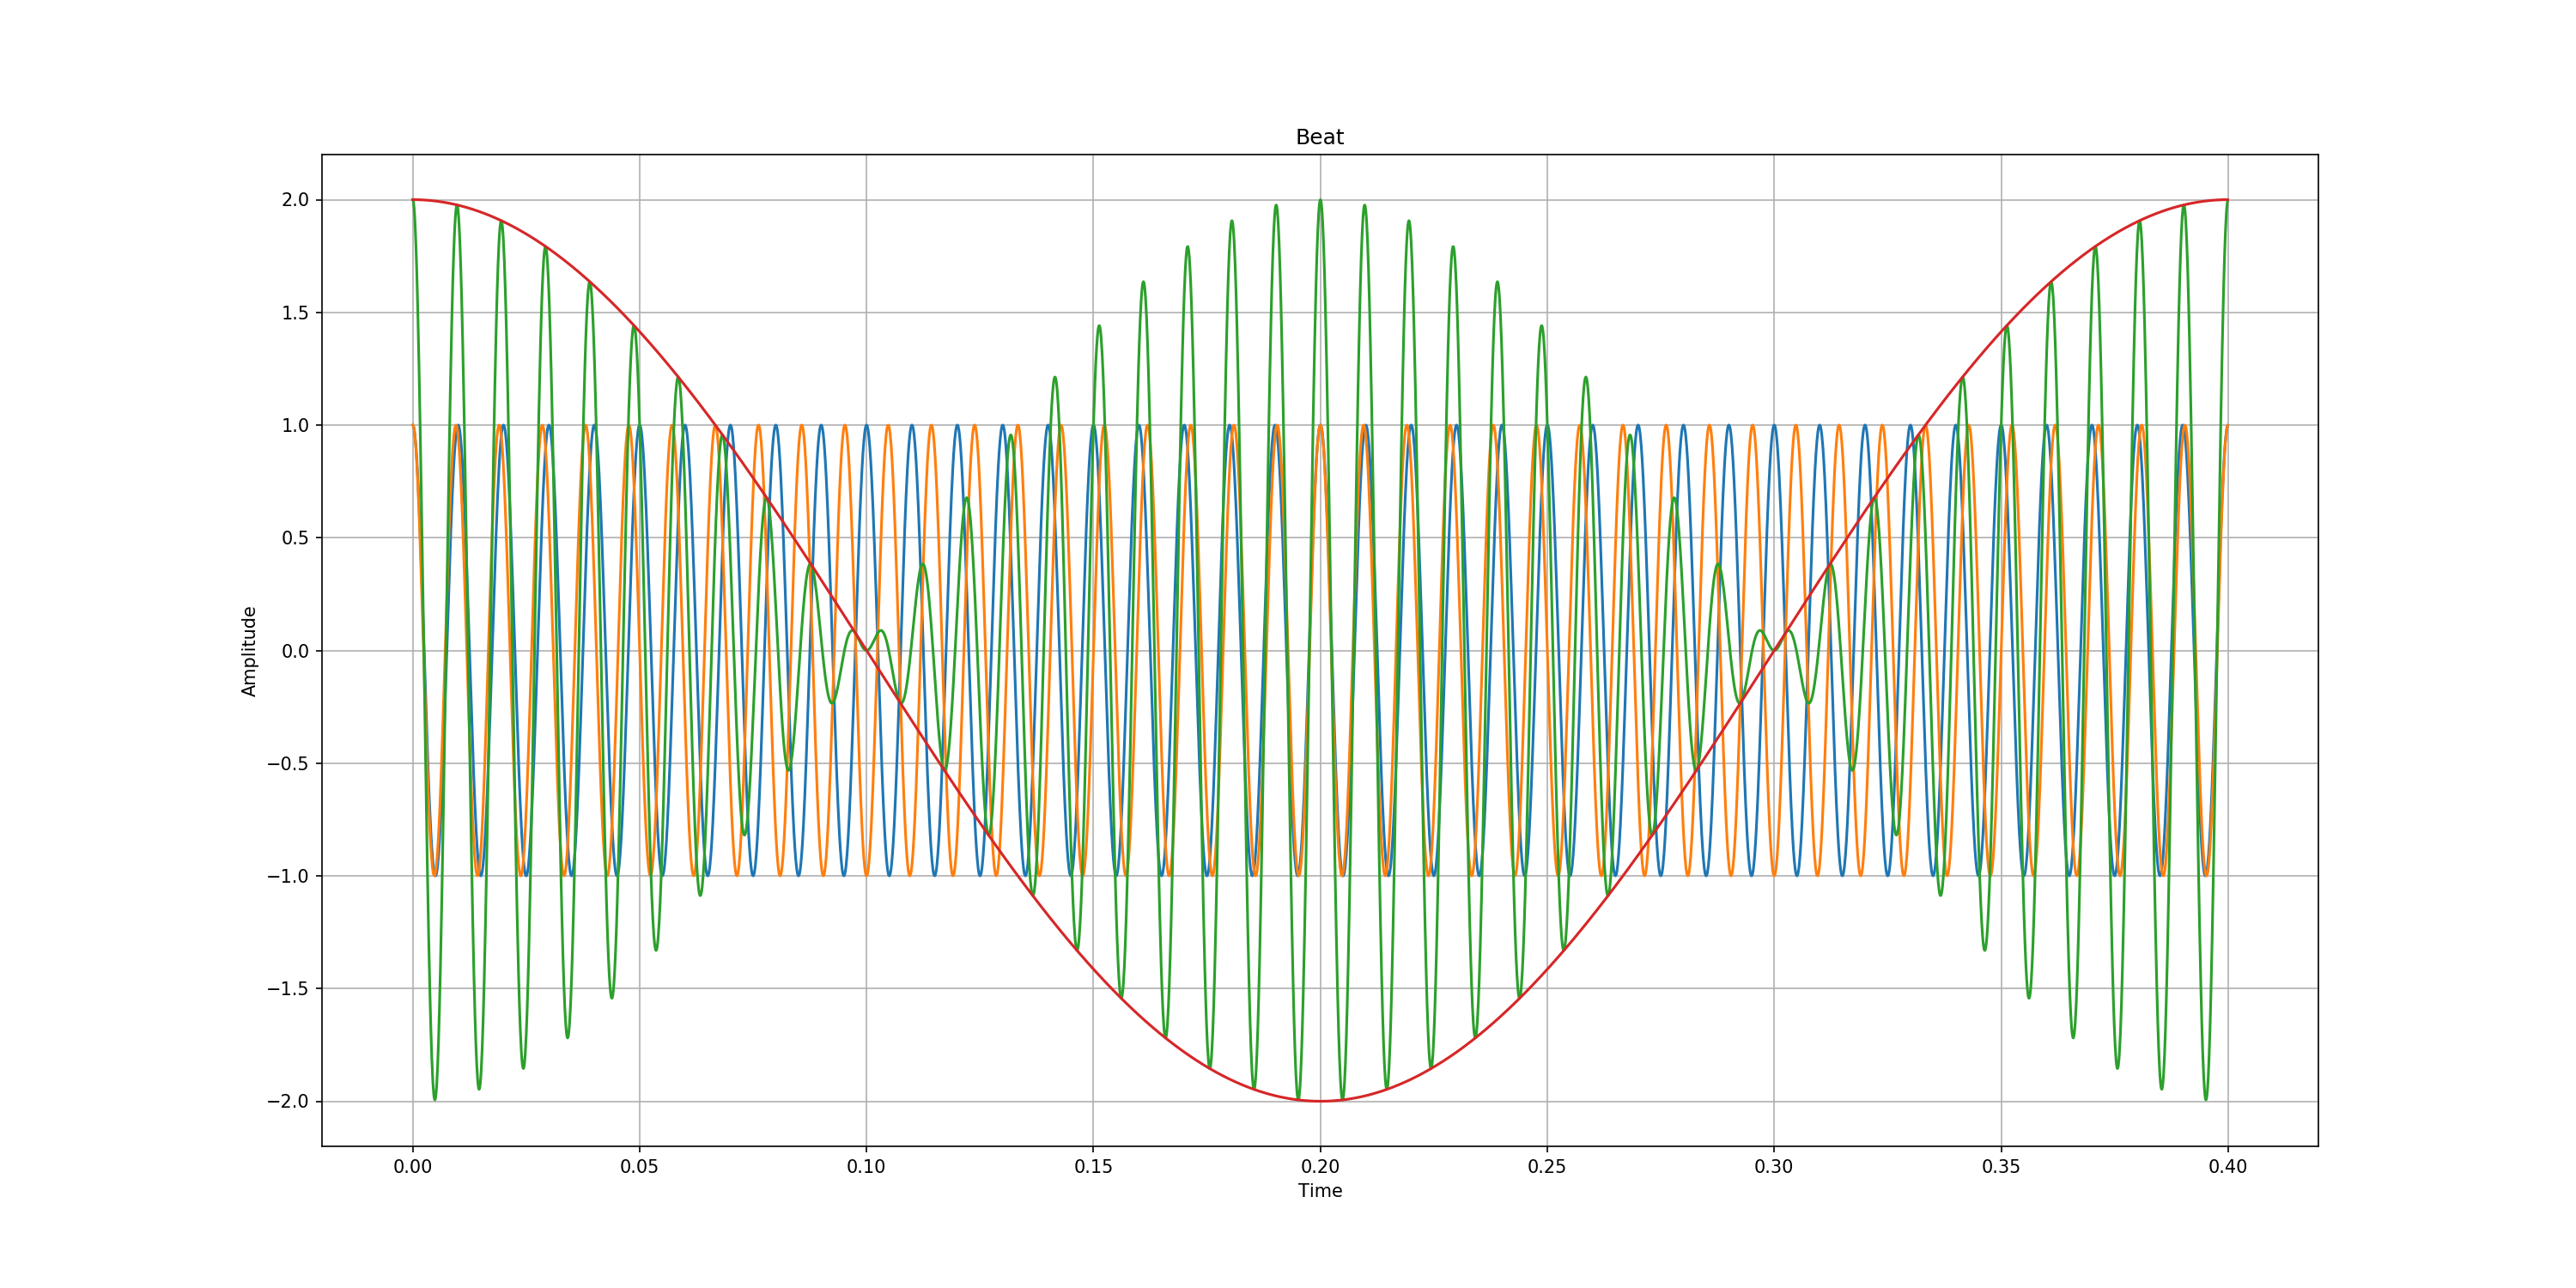
8.1.1. Acoustic Beat
In acoustics, a beat is an interference pattern between two sounds of slightly different frequencies, perceived as a periodic variation in volume whose rate is the difference of the two frequencies.
8.1.1.1. Theory
The sum of two sinusoidal signals is:
\[\cos(2\pi f_1 t) + \cos(2\pi f_2 t) = 2 \cos\left(2\pi \frac{f_1 + f_2}{2} t\right) \cos\left(2\pi \frac{f_1 - f_2}{2} t\right)\]
If the frequencies are close enough, we can rewrite this expression using \(f2 = f1 + f_\delta\)
\[\cos(2\pi f_1 t) + \cos(2\pi f_2 t) = 2 \cos\left(2\pi \frac{2 f_1 + f_\delta}{2} t\right) \cos\left(2\pi \frac{f_\delta}{2} t\right)\]
where \(f_\text{beat} = f2 - f1 = f_\delta\)
8.1.1.2. Simulation
import numpy as np
import matplotlib.pyplot as plt
from matplotlib.ticker import MultipleLocator

from Musica.Math.MusicTheory import *

delta_frequency = Frequency(5)
frequency1 = Frequency(100)
frequency2 = Frequency(float(frequency1) + float(delta_frequency))
beat_frequency = Frequency(float(delta_frequency) / 2)

t = np.arange(0, beat_frequency.period, frequency1.period / 100)

y1 = np.cos(t * frequency1.pulsation)
y2 = np.cos(t * frequency2.pulsation)
yb = 2 * np.cos(t * beat_frequency.pulsation)

figure = plt.figure(1, (20, 10))

axe = plt.subplot(111)
axe.set_title('Beat')
axe.set_xlabel('Time')
axe.set_ylabel('Amplitude')
axe.grid()
axe.plot(t, y1)
axe.plot(t, y2)
axe.plot(t, y1 + y2)
axe.plot(t, yb)

plt.show()